Quantcast
Channel: Tutorial – PhpStorm Blog

Docker Support in PhpStorm

$
0
0

large_v-transDocker is an open platform for building, shipping and running distributed applications. It gives programmers, development teams and operations engineers the common toolbox they need to take advantage of the distributed and networked nature of modern applications.

With the new Docker integration plugin for PhpStorm, you can add Docker support to existing projects, view logs, manage Docker containers, and debug PHP web applications from right inside PhpStorm.

In this blog post we overview some of the most important features and configurations; for more details please refer to the full tutorial on Docker Support in PhpStorm.

Prerequisites

First of all, you’ll need to install Docker and related tools so that you can take advantage of the Docker integration in PhpStorm. Please refer to the Docker documentation to get more information about the installation process for various platforms or the cloud.

You will also need to install the Docker integration plugin in PhpStorm (in Settings /Preferences | Plugins, click the Install JetBrains plugin…).

PhpStorm & Docker Integration Configuration

To start using Docker, the default Docker machine should be launched using the Docker Quickstart Terminal (Windows / Mac OS X, for Linux you need to use a standard terminal executing a sudo docker run hello-world command). At the next steps we’ll need some of the parameters of this machine environment, so we’ll need to run docker-machine env default console command to get all the necessary parameters (Windows / Mac OS X, for Linux you’ll need to use a standard IP address 172.17.42.1), such as DOCKER_HOST and DOCKER_CERT_PATH:

As soon as we have Docker running (and all the parameters fetched for future use), we can start configuring PhpStorm to work with Docker.

Create a Docker configuration with the + button in Settings / Preferences | Build, Execution, Deployment | Clouds:

We’ll need to provide the configuration name (Docker), API URL (https://192.168.99.100:2376, taken from the previous step), and Certificates folder (/Users/mikhailvink/.docker/machine/machines/default).

Please note that you will need to provide a socket path in the API URL field on Linux machines (unix:///var/run/docker.sock by default).

Next we need to create a new Docker Deployment Run/Debug Configuration in the Run | Edit configurations… menu.

Provide all the necessary parameters on the Deployment and Container tabs:

At this point we are interested in exposing port 80 of the container to be available from our local machine, so we should configure a port binding for that:

There are many ways to create/configure Docker containers and VM images; please refer to the Docker documentation on their official website.

For the purposes of this tutorial we’re making some configuration in the Dockerfile and Apache configuration file, so do have a look at them. You can download the entire project used in this demo or separate config files (apache-config.confDockerfile) which then need to be placed in the project root folder.

Running the Docker from PhpStorm

As all the tools are installed and the integration is configured, the recently created Start Docker Run/Debug Configuration can be launched. The Application Servers tool window will be opened updating you on the provisioning status and current state of all your Docker containers:

As soon as our Docker_Xdebug container’s status turns green, we can check how it works in the browser. You should be able to open it with a URL similar to http://192.168.99.100:8080/ (http://host:port192.168.99.100 is the IP address of the default Docker machine).

Managing Docker containers and other Docker-related actions in PhpStorm

From the Application Servers tool window, it’s easy to inspect containers and view the running processes. You can also search through logs, start and stop containers, and perform basic container management like creating and deleting containers.

Debugging PHP web application running in the Docker container

The main challenge in getting Xdebug (or Zend Debugger) working with PhpStorm and Docker integration is the correct configuration of the Docker container.

In our case we’re using a Dockerfile (we’ve already shown this config earlier and provided links to download it) to configure the container, including Xdebug-specific parameters, such as:

#Set up debugger
RUN echo "zend_extension=/usr/lib/php5/20131226/xdebug.so" >> /etc/php5/apache2/php.ini
RUN echo "xdebug.remote_enable=1" >> /etc/php5/apache2/php.ini
#Please provide your host (local machine IP) instead of 192.168.2.117
RUN echo "xdebug.remote_host=192.168.2.117" >> /etc/php5/apache2/php.ini

Please note that xdebug.remote_host value should be replaced with your local machine IP address which is visible from the Docker container (where PhpStorm is running, in our case 192.168.2.117).

Don’t forget to re-run Start Docker Run/Debug Configuration so that all the changes are applied.

As soon as all the configs are in place, the debugging process can be triggered by following this tutorial starting with step 2 (start Listening for PHP Debug Connections, set a breakpoint in the source code, and start a debugging session in the browser, reload the current page, debug) to get the debugger up and running in a few moments:

Please have a look at the full tutorial on Docker Support in PhpStorm for more information.

Please share your feedback on Docker support in PhpStorm in the forum, comments to this blog post, or our issue tracker. Thanks!

Develop with pleasure!
JetBrains PhpStorm Team


Debugging VVV Vagrant Setup With PhpStorm

$
0
0

It started with a Tweet:


Recently we’ve made a lot of changes to debugging in PhpStorm to try and make the process as simple as possible, so I decided to blog about not only how to get debugging working, but the process I used to figure out exactly what needed to be changed.

Varying Vagrant Vagrants is a Vagrant setup designed to make working with WordPress as easy as possible. It has various versions of WordPress running under separate URLs. For this exercise, I installed the plugins that the documentation recommended, and then cloned the repository, and used vagrant up to bring the box up and run its provisioners.

The good news is this was really simple and allowed me to hit the current stable version URL at http://local.wordpress.dev quickly and easily to see my working WordPress install.

The first thing I did was to open the project in PhpStorm. I’d cloned VVV into the www directory in my user’s home folder under the name vvv. I didn’t want to confuse everything by opening the various different versions of WordPress in one project, so I just used PhpStorm’s Open Directory option to open a project from ~/www/vvv/www/wordpress-default. This gave me a project open that linked directly to the webroot of the http://local.wordpress.dev URL. It’s important to consider these factors when you are deciding what to make your projects root to make mapping paths easier — more on this later.

At this point, I have no idea how this vagrant box is configured. Is it using Apache? Is it using Nginx and PHP-FPM? Who knows! It’s really not that important, but generally, the first thing I do once I’ve opened the project is to tell PhpStorm which PHP install I’m going to use. Doing this straight away tends to sort out potential problems further down the line less likely.

The settings we want are found in the preferences pane under Languages & Frameworks then PHP (if you are as lazy as I am, you can use CMD/CTRL+SHIFT+A to search actions and then type interp to go right there). We’ll need to define a new interpreter, so press the […] button next to the Interpreter: drop down, to be taken to the Interpreters management screen.

Interpreters Dialog

You can see that currently I only have my global local PHP install configured, so we’ll need to create a new interpreter for this Vagrant box to tell the project to use it. It’s relatively straightforward to create an interpreter for a vagrant machine, I used the following steps:

  • Clicked the [+] to add a new interpreter and then selected Remote
  • Selected the Vagrant radio box, and in the Vagrant Instance Folder I put the root folder where I cloned VVV – ~/www/vvv/www/wordpress-default
  • PhpStorm thinks for a minute and then fills in the rest of the information correctly, once it did I clicked OK
  • PhpStorm connected to the Vagrant box and confirmed all is well, it then opened the completed interpreter setting dialog

vvv-created-interpreter

There are few things to note here. Firstly, I ticked the Visible only for this project box, as I don’t want to see this interpreter in other PhpStorm projects. I also noticed that the PHP executable has been detected correctly (yay! PHP 7!), but that there is no debugger installed. I’m not too worried at this point, I have no idea how this machine is configured, and it may have Xdebug only set for HTTP requests, and not for CLI.

With things looking right here, the next thing I want to do is to check if Xdebug is installed, and if so, how it’s configured. Recent versions of PhpStorm ship with the Web Server Debug Validation tool (found under the Run menu). Before we can run that, we need to create a deployment server so that PhpStorm knows the locations of local files, and how to map those to files on the server, I selected the Remote Web Server option, and then clicked the […] button to open the Deployment Server dialog.

We also need to create a deployment using SFTP. This may be a little confusing because we’ve already told PhpStorm we’re using Vagrant, and it should be able to infer this from there. We only need to create a deployment configuration for the debug validation tool so that the tool knows where to create a file and be able to call it via an HTTP request. This may seem painful, but we only need to do this to be able to run the validation tool:

vvv-deployment-main vvv-deployment-mapping

Notice how I had to use the URL I’m using to access the site as the SFTP Host rather than the IP address, and I’ve added a simple mapping from the project root on the host machine to the project root in the virtual machine. After we run the debugger configuration validation tool, we see this:

vvv-validate-results

My earlier fears when creating the interpreter are correct – PHP on the virtual machine doesn’t have Xdebug installed and configured. After some investigation with the VVV documentation, I found this is an easy fix; we can simply vagrant ssh into the Vagrant box, and run xdebug_on to install and configure Xdebug.

I took a look at the settings that this script configured Xdebug with, and they looked good to me with the exception that I prefer to use the xdebug.remote_connect_back setting to send debug sessions back to the IP address that made the request, rather than to specify the IP address manually. I left the settings as VVV configured them.

Heading back to PhpStorm, we can run the debug configuration validation tool again, and this time, we see everything looking promising:

vvv-validate-works

Now we see that everything is blue, and I have confidence that the debug session will work as expected.

To test the debugger, I opened index.php and set a breakpoint on line 17 just before the actual WordPress main file is required. At this point, I’m not interested in actually debugging anything, I only want to check that the script stops, and PhpStorm is opened with step debugging available. After listening for connections, I head over to Chrome and enable debugging via the Chrome extension I use, then hit refresh…

Nothing happens, the script hangs, but looking at PhpStorm I can see that a debugger session has started, but PhpStorm appears to be just sitting there without actually debugging. This is a common problem when PhpStorm can’t figure out how to map the files on the server to the files in your local project — we have a path problem. Clicking on the Debugger tab in the Debug pane that has opened, there’s a message that confirmed the problem is as suspected:

vvv-problem

Even though we’ve already told PhpStorm previously how to map files from our local machine to the Vagrant host, there is a problem here (and it’s actually one that took me a while to spot). We mapped the local path to the shared folder path on the Vagrant box, which is /vagrant, but the actual files are being served from /srv/www. This is probably because of symlinks, or other such trickery; I looked but couldn’t figure it out in my 2 minutes cursory glance.

If you look carefully at the error you’ll see the mapping you need to create to make all things golden, we need to tell PhpStorm where to find  /srv/www/wordpress-default in the local project, and we can do that by clicking on Click to setup path mappings. In the box next to the local path to wordpress-default, add the location on the server as /srv/www/wordpress-default, and press enter.

vvv-mapping

The OK button should become enabled. Again, it’s worth pointing out that we only need to create this additional mapping because there is a discrepancy between the shared folder that we’ve already mapped at /vagrant and the location of the webroot at /srv/www. In most other configurations we wouldn’t need to do this.

When we hit OK, everything works as expected and we can start debugging WordPress as needed. It took me around 35 minutes to get debugging working, mainly because as a developer and a human being I didn’t read the error in the debug pane that explained the problem. I  just glossed over it and assumed it was a mapping problem with the /vagrant folder and not the /var/www folder. Once I actually read the message it took 20 seconds to actually get debugging working.

This is a long post intentionally. I wanted to explain my process for actually solving debugging problems step by step rather than just give the actual answer to this problem. Hopefully, that helps other people to solve their debugging issues, particularly when you’re working with a 3rd party virtual machine or container that you have no experience with.

Let me know if this helps you.

 — Gary and the PhpStorm Team

Updating Your Templates in PhpStorm

$
0
0

In the recent What’s New video for PhpStorm 2016.3, I noticed I was always adding PHP 7’s strict type declaration declare(strict_types=1) to every new file I created.

I commented at the time that I should update my default templates to include this by default and was asked at the time how to do that. I said I’d record a video, but I’ve realised it’s such a simple task that this blog post covers it.

So, to update your default templates, open your settings pane and navigate to Editor then File and Code Templates and in my case PHP File, PHP Class, PHP Interface, PHP Trait and PHP Unit Test. You can then update the new file template in the right-hand pane — I’m adding the declaration for strict types.

php-templates

If you want to edit anything that’s included, you can use the Includes tab — the Code tab has the templates that are used when you use code generation, when you create Getters and Setters for example.

I hope this helps, sorry for the delay!

 – Gary and the PhpStorm Team

VCS in Depth for PhpStorm

$
0
0

Last summer the PyCharm team released some amazing content introducing the version control system (VCS) in PyCharm. These videos are equally as relevant to PhpStorm as they are to PyCharm, as the two IDEs share the same underlying platform.

We understand that the editor being different can be slightly distracting and that you’d prefer to see PHP files instead of Python in the video, but these videos are just too useful not to share. So try and get past the odd indenting, and predictable function arguments, and give them a go. Just like that strange black and white film with subtitles, once you get into the video you’ll hardly notice the differences between PyCharm and PhpStorm.

The first video gives an introduction to VCS, including versioning without a VCS (using Local History), setting up a local Git repository, uploading to GitHub, and checking out from GitHub.

The next episode covers the fundamentals: Color Coding, Adding Files, Committing Changes, Using Refactor, then Diff, History, Revert, and Update.

Finally, to the more complicated stuff: branching, merging, and pushing.

We’d love to hear what you think. Could you get past the fact that it’s the wrong IDE or was that a leap too far? Drop me a Tweet and give us some feedback.

— Gary and the PhpStorm Team

Git Questions – How do I switch branches without losing my work?

$
0
0

Git can be hard, particularly if you’ve been dropped in at the deep end and are only used to working in a specific way, so it’s our intention to address how to accomplish certain version control tasks in a JetBrains IDE during this series.

In this first episode, myself (Gary Hockin, Developer Advocate for PhpStorm) and Trisha Gee (Developer Advocate for IntelliJ IDEA and all-around Git expert) sit down to discuss how to swap branches without losing your work.

We’d love to hear what you think of this different format. It’s meant to be less formal, more like a series of video podcasts than polished screencasts. Let us know what you think in the comments, or you can tweet me at @GeeH, or Trisha at @trisha_gee.

Without further ado, here’s the video.

 — Gary and the Developer Advocacy Team

Cloning From GitHub

$
0
0

In the third video in our series, Trisha Gee and myself look at how you clone your own copy of a repository from GitHub.

This is really useful if you’d like to contribute to an open source project, or just work with GitHub in your daily life. It’s worth noting here that I use WebStorm and a JavaScript project, but that’s only because I wanted to feel hipster. Exactly the same process will work with PhpStorm and PHP projects.

As usual, let us know what you think in the comments, we’ll try and keep these coming if you like them.

— Gary and the PhpStorm Team

Taking control of PhpStorm updates

$
0
0

PhpStorm updates are usually patch-based: they are applied to the existing installation and only require you to restart the IDE. Due to the current limitations of the update system, these patches can only be applied sequentially, on top of one another. For example, if you are using PhpStorm 2017.1.1, you can patch it to 2017.1.2, but not to 2017.1.3.

If you skip or ignore a patch, you will lose the ability to apply the subsequent patches. As a result, when a new PhpStorm version is released, you will see a dialog box prompting you to download and install it:

ps_update_download

If this happens, you can restore the ability to apply patched-based updates by manually applying skipped updates one by one.

Follow these steps:

  1. Ignore the proposed update by clicking Ignore This Update. This way, you will add the proposed build’s number to the Ignored updates list.
  2. Open the PhpStorm Settings / Preferences dialog and navigate to Appearance and Behavior | System Settings | Updates.
  3. Click the Check Now button to check for available updates. If you only skipped a single update, the update dialog box will now prompt you to update and restart PhpStorm. Otherwise, keep ignoring the proposed updates until a patch-based update is proposed.
  4. Update and restart PhpStorm.
  5. Navigate back to the Updates settings page and click the View/edit ignored updates link to open the Ignored updates list.
  6. Delete the ignored build’s number from this list and check for available updates once more. The update that you have un-ignored will show up, and you can now apply it as a patch as well. Note that if you have ignored several updates, you need to remove and apply them one by one, starting from the oldest update.

A note for EAP users: you can update PhpStorm only to a minor EAP release, but not to the major one. For example, you can update PhpStorm 2017.2.3 to 2017.2.4 EAP but not to 2017.3 EAP. The 2017.3 EAP version in this case will be installed in parallel with your existing stable installation. EAP versions, however, can be updated to both newer EAP and stable PhpStorm versions.

Manage PhpStorm through Toolbox App

If you prefer a one-stop shop for managing all your developer tools, consider Toolbox App. It’s great for downloading and updating all your JetBrains developer tools, as well as launching your recent projects, from one convenient place. Maintain different versions of the same tool, install updates, and roll them back if needed. Toolbox App also remembers your JetBrains Account and uses it to automatically log you in when you install and register new tools.

To install Toolbox App, follow these steps:

  1. Download Toolbox App.
  2. Launch the downloaded file.
  3. When the installation is complete, accept the JetBrains Privacy Policy and sign in to your JetBrains Account.

ps_toolbox_manage


We hope it will help you to keep your PhpStorm updates under control and will make an update process more smooth and clear.

JetBrains PhpStorm Team
The Drive to Develop

Editor-based Rest Client

$
0
0

Among other features introduced in 2017.3 EAP we mentioned the editor-based REST client, which offers a new approach to working with web APIs.

Earlier, you could run your requests with the REST client built right into PhpStorm, but it required crafting each request by hand with lots of button clicking, adding and completing of fields, and so on.

What if we wanted to leverage the power of the PhpStorm editor for the very same task, with completions, refactorings, navigation, VCS capabilities and what not? That’s where the new editor-based REST client comes in. No more fiddling with tool windows: your HTTP requests are now first-class citizens in PhpStorm.

Working with the Editor-based Rest Client

The new REST client’s interface will be instantly familiar to you, since it’s the code editor itself.

You work with HTTP requests by creating and editing the corresponding HTTP request files (using the .rest or .http extension), which are now supported by PhpStorm. If you worked with web APIs before, the HTTP format syntax will feel common and natural. It generally follows the RFC standard but includes several accommodations to better fit your developer needs.

You can start working with a web API by simply creating a new scratch file, setting its Language to HTTP request, and typing the request.

We’ll use the excellent (and free) service called httpbin to test our example requests.
Let’s start with a very simple request to https://now.httpbin.org/, which should return current time. Notice that as soon as you start typing, the completion mechanism offers completing the request scheme. Note also that you can freely omit the GET method type as it is the default.

new_scratch_file

Feel free to use completion while composing the request. Now, it supports message type (GET, POST, etc.), request scheme (http, https), HTTP request version (HTTP/1.1), header names, content types, and encodings. We plan to enhance its capabilities in the future.

As soon as you finalize the request, you can immediately run it by either clicking the Run icon in the left gutter or invoking the Run request intention action with Alt+Enter:

run_request

The request’s detailed execution results are displayed in the Run tool window:

request_results

Right after your original request in the editor, you will now see the link to the response output, which is a JSON file in our case.

request_results_link

Since this response actually gets saved to a file, we can use Jump to source (or CMD-click) to open it in a new editor tab.

If you run the request again, the link to the second response appears. What if you wanted to compare these responses? Simply click the gutter icon or use the Compare intention action to open the files in the Differences viewer.

request_results_compare

Let’s try another example. There’s no need to create a new file for that: simply use ‘###’ as a separator between requests.

request_from_file

This request will return nothing of particular interest when executed, but it still illustrates several capabilities of HTTP request syntax:

  • You can use comments inside your requests – just make sure to start each comment line with ‘#’ or ‘//’.
  • You can break long query strings into several lines by indenting all but the first line of the string.
  • You can use the left angle bracket (‘<’) and provide the path to a file, test.json in our case. The request body will then be sent from the specified file.

As you may remember, we have been executing our requests from a scratch file. Such files are commonly used in the development process. If you want to include your request inside the project and share it with your team, move it to a physical file. Invoke the Move refactoring and specify the destination:

move_request

That’s it! The created file will be stored inside the project. Physical files are primarily used for documenting HTTP requests and are not modified by the IDE. Therefore, when you run a request from a physical file, you will not see the link to the response below the request itself. To view responses, you will need to use Requests history, so let us explore that right away.

After a hard day’s work, you may want to review the requests that have been run. Simply click the Show HTTP requests history button in the top-right corner of the editor (or use the Tools menu command with the same name). The http-requests-log file will open, showing you the 50 most recently run requests and responses and allowing you to re-run any of them:

requests_history

Future plans

In this post, we’ve really only scratched the surface of what’s possible with the new REST client. We encourage you to try it and hopefully have an easier time testing and debugging your web services.

Please bear in mind that we’ve only started working on the new REST client. Expect a lot more features to come in future releases, such as variables inside requests, in-place documentation for Header Fields, live templates, refactorings, inspections, importing and exporting requests, and many more.

Stay tuned!


Connecting to Deployment Servers and Remote Interpreters with SSH-Agent

$
0
0

When you work with remote servers, a common and recommended security measure is to use SSH key pairs for authentication.

Our friends at PyCharm have prepared a great blog post on the topic. It explains how to generate an SSH key pair, store the passphrase for the private key in the credential helper, and, in the end, how to connect to a remote Python interpreter over SSH using the generated key pair for authentication.

Before proceeding, make sure that you have a remote machine at hand to which you can connect over SSH using the generated key pair. Also, make sure to add your key to the credential helper application (SSH agent, Pageant, or a compatible tool). If you don’t have a spare remote machine, you can use the example Vagrant box provided as part of the above tutorial.

When ready, jump right into the PhpStorm specifics.

Using SSH key-based authentication in PhpStorm

In PhpStorm, we can make use of SSH keys and credential helper applications in two areas: when configuring remote deployment servers and remote PHP interpreters. Both scenarios involve the same setup technique, and we can actually reuse an existing remote deployment server configuration for setting up an interpreter.

Setting up a remote deployment server

To connect to a remote deployment server over SSH, we need to create a new server access configuration of the SFTP type.

Navigate to Settings / Preferences | Build, Execution, Deployment | Deployment. Then, click + to add a new SFTP server:

new_remote_deployment_server

Next, provide the server parameters:

remote_deployment_server_parameters

In this tutorial, we’ll use the values that will allow us to connect to the example Vagrant box:

  • SFTP host: localhost
  • Port: 2222 (the default port that Vagrant exposes for SSH).
  • User name: example
  • Auth type: Authentication agent (ssh-agent or Pageant)

By setting authentication method to Authentication agent, you’re instructing PhpStorm to use the credentials stored in the credential helper application (SSH agent, Pageant, or a compatible tool).

Once the parameters are set, test your connection, apply the changes, and you’re good to go!

The remote server that we have configured will probably handle our PHP code as well. We can reuse its configuration for setting up a remote PHP interpreter. First, let’s ensure that PHP is installed on the remote server. Select Tools | Start SSH Session… in the main menu and select the remote host in the pop-up window:

select_host_to_connect

Since your SSH keys are managed by the credential helper, the SSH session should instantly start in the built-in PhpStorm terminal without requiring you to type anything. To find out whether PHP is installed, run the php -v command:

terminal1

The command is not found, which means that PHP is not installed. We can easily fix this by running the following command:

sudo apt-get install php

Note that this command requires elevated privileges, i.e. entering your password. In our Vagrant box, the password for the example user is set to hunter2. Type it in when prompted, and wait a short while until PHP is installed. To be absolutely sure, you can run the php -v command once more:

terminal2

Setting up a remote PHP interpreter

PHP is now installed on a remote server, and instructing PhpStorm to use it could not be simpler. Navigate to Settings / Preferences | Languages & Frameworks | PHP and click the ellipsis (…) button next to the CLI Interpreter field:

preferences_php

In the opened CLI Interpreters window, click + and select the From Docker, Vagrant, VM, Remote… interpreter type:

new_cli_interpreter

PhpStorm will detect a remote deployment server configuration that we created earlier and will suggest reusing it as a configuration for the remote interpreter:

remote_interpreter_ssh_deployment_config

Click OK, apply your changes, and you are done! You can now upload, download, and manage remote files directly in PhpStorm, as well as execute your PHP code remotely.

As a side note, if you need to set up only a remote PHP interpreter, without reusing an existing deployment configuration, choose the SSH Credentials option in the above dialog box. Provide the server parameters and select the Authentication agent (ssh-agent or Pageant) authentication type – just as you would for configuring a remote deployment server.

JetBrains PhpStorm Team
The Drive to Develop

Install PhpStorm with Snaps

$
0
0

Exciting news for Linux users: you can now use snaps to install PhpStorm builds. Snaps will update your app automatically, and you’ll always have a fresh PhpStorm build right out of the oven. Snaps are really easy to install and use. On Ubuntu 16.04 LTS or later, snaps come pre-installed. On other Linux distributions, you will need to install snaps first, as described here.

We currently distribute PhpStorm on the Edge and Stable channel where we store our EAP and stable builds, correspondingly. To install PhpStorm EAP via Snaps from the command-line, run the following command:

sudo snap install phpstorm --classic --edge

To install stable:

sudo snap install phpstorm --classic

To run PhpStorm, run this snap command: phpstorm

We would like to know what you think about snaps. Add your comments here or tweet @phpstorm. Your feedback is welcome!

Integrating Composer command line tool with PhpStorm

$
0
0

Built-in Command Line Tool support plugin provides autocompletion and documentation for any command line based tools. It needs just an xml commands description to support new tool. We plan to add automatic recognition of composer and other popular tools in future, but you can have it working today.

To get Composer dependency manager support in PhpStorm you need to open Settings | Command Line Tool Support and add custom configuration:

Set up alias you’d like to invoke and <php path> <composer path> in Tool Path, and then apply changes.

Then open xml description in editor by pressing and close settings. Copy and paste content of <framework> element from here. Or copy whole description, but then check alias and tool path of Composer in Settings. Voila!

Develop with pleasure!

SQL support and Database tools

$
0
0

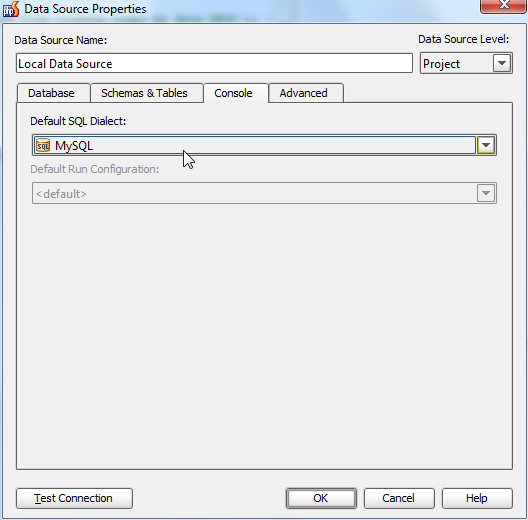
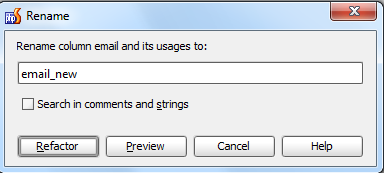
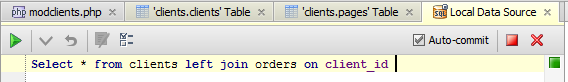
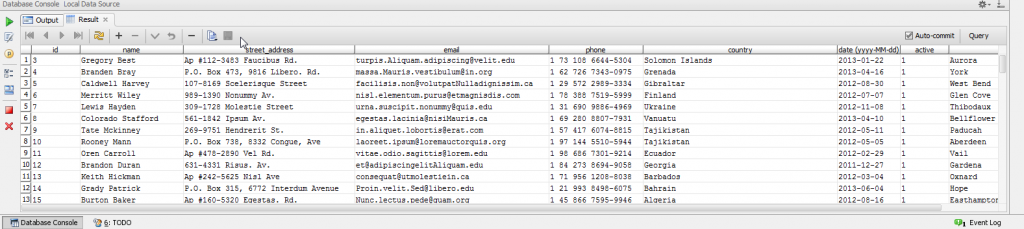
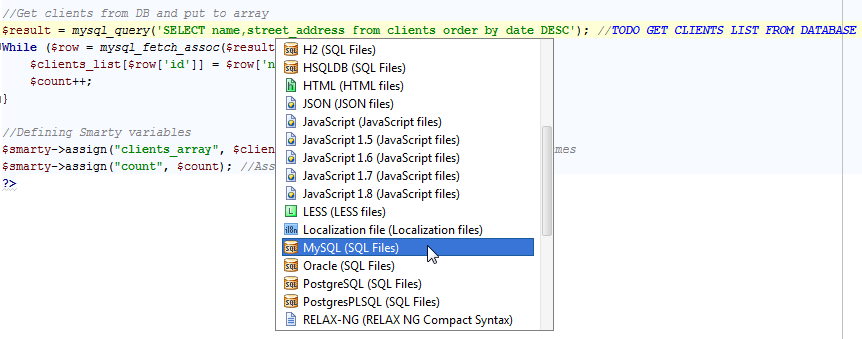
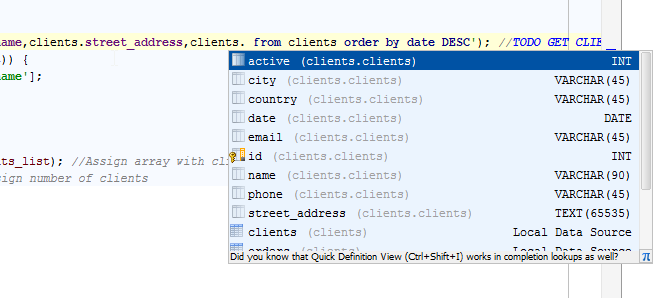
As you work with databases in your project, there are quite a lot of routine tasks that have to be performed on a regular basis. However, now there is a great way to do it right from your IDE. You can view database structure and easily modify it by refactoring affected code; manage data stored in the table simply editing or adding values; write SQL queries with smart code completion and syntax highlighting; and run SQL queries just from the code or the built-in SQL editor.

If you have more complicated tasks to perform, there are UML diagrams showing relations between tables and tools to compare databases and migrate from one to another.

We will give you a short overview of the Database tools and SQL support in our products.

This functionality is available in IntelliJ IDEA, PyCharm, PhpStorm, and RubyMine.

All the features are supported out of the box, without any external plugins. You can work with databases such as MySQL, PostgreSQL, Oracle, DB2 and others.

To take advantage of all the features, just add a data source to your project.

To open the Database Tool Window on the right, click the Database button or go to the main menu and select View | Tool Windows | Database, and then add DB Data Source.

Enter the data source name, choose JDBC Driver (for example MySQL), then click to download the connector and specify the folder to save it to.

JDBC driver is a software component enabling an application to interact with a database. Most JDBC drivers cannot be bundled with the IDE because of license terms. However, even if no restrictions existed, it would be too much to force our users to download an IDE with all the popular (but not necessarily needed) libraries bundles, as software package size is important too. So, to download the required driver, you only need to click a few buttons.

Now that we have a JDBC driver installed, we need to configure it. If you are not fluent with JDBC connectors, please consult MySQL documentation for details about the correct MySQL JDBC URL syntax. Enter the Database URL, Username and Password. You can easily test connection in order to check if everything went well.

Next, specify the Schemas & Tables we need to scan. They’ll be used for autocompletion. Just select the ones you need in your project.

Don’t forget to specify the Default SQL Dialect on the Console tab. In our case it’s MySQL. The Default SQL Dialect should be selected in order to take advantage of smart SQL code completion in the SQL editor or inside your code.

Just click OK. We’ve got our MySQL Database structure on the right: tables, columns (fields), indexes, etc. You can easily manage your database from the database tool window.

For example, let’s rename email field to email_new.

And with a single button we apply a refactoring to the whole project (just make sure to check what occurrences should be affected).

By the way, invoking ‘edit table dialog’ with F4 hotkey or double-click on the table will show you all the table data so that you can easily add/edit/remove values, order columns, export data to file, etc.

Open Database Console using hotkey Ctrl+Shift+F10/Cmd-Shift-F10 and enter a query in SQL editor, supported by syntax highlighting, smart code completion, on-the-fly code analysis, multiple intentions, and navigation.

Run it and get results immediately!

You can also use UML Diagrams in order to view tables and relations between them with Ctrl+Shift+Alt+U/Meta-Alt-Shift-U hotkey.

One more powerful feature is SQL code injection. You can use it easily while writing your code in order to get all the features of SQL editor inside PHP, JavaScript, HTML or other languages. In the editor, place the cursor within the string literal that represents the language injection of interest. Click on the yellow bulb or press Alt+Enter, and select the language to use (MySQL in our case).

Also, a piece of your code will be considered as injected code with automatic patterns from IntelliLang (for SQL predefined patterns are select/delete/insert/update/create and <<< SQL Heredoc). These patterns can be adjusted in Settings | Language Injections. Please note that it will not work on concatenated literals (such as “…WHERE VAR=”.$var.”…”).

That’s it! Now you have syntax highlighting, smart code completion, and on-the-fly code analysis for SQL inside your code.

Feel free to run SQL query in the console just from your code! Press Alt+Enter and select the appropriate option. Results will be shown in the database console. If any parameters are missing (for example, WHERE condition which depends on variable), the IDE will ask you to provide it in a special window.

You can also export and import DDL data sources just from the database tool window.

If we have several data sources, we can select them and compare. Found some difference? Migrate between data sources with a single button.

And one more important thing for today. Do you need to find where you use a certain column or table? Just select it in the database tool window and invoke Find Usages with Alt+F7:

Now you see why you really don’t need any external database management software. All you need is already inside your IDE! Just add a data source and start working with your database. No need to switch: you can handle your data quickly, conveniently and reliably using just one window.

Develop with pleasure!
-JetBrains Web IDE Team

Find your way around your code

$
0
0

You constantly move around your project – switching between editor tabs, navigating to files, directories, classes, functions, comments, declarations, and so on and so forth. It’s easy to lose direction when you move and always have to think where to find the one line or place in code you need right now.

If there’s a key metric for being productive and efficient while coding, it has to do with cutting the time you lose on side actions such as configurations, line/file/class search, navigation, etc. This time should be minimized as much as possible.

For this reason, a smart IDE aims to guide you around your code, to help you keep up your coding pace, and not scroll thousands of source code lines just to find something you need. Here we provide an overview of must-know navigation methods that JetBrains IDEs offer.

This functionality is available in IntelliJ IdeaPyCharmWebStormPhpStorm, RubyMineAppCode.

  • Find action. Find the desired action without digging through menus or toolbars (covers the commands of the main menu and various context menus, commands performed through the toolbar buttons of the main toolbar and tool windows). Choose Help | Find Action from the main menu or press Ctrl+Shift+A / Cmd+Shift+A. Press it one more time to include the non-menu commands in the suggestion list:

  • Go to file. Quickly navigate to the desired file, specified by name. The IDE suggests a list of matching names from which you can select the one you need and open it in the editor. This navigation honors CamelCase and snake_case capitalization, as well as wildcards. Press Ctrl+Shift+N / Cmd+Shift+N to invoke this:

  • Go to class. Quickly navigate to the desired class specified by name. Press Ctrl+N / Cmd+N to invoke this:

  • Go to symbol. Quickly navigate to the desired symbol specified by name. Press Ctrl+Shift+Alt+N / Cmd+Shift+Alt+N to invoke this:

  • Go to declaration or type declaration of a symbol. Navigate to the location where a particular named code reference (a symbol) has been first declared. To navigate to the declaration of a symbol: place the caret at the desired symbol and choose Navigate | Declaration or press Ctrl+B / Cmd+B or click the middle mouse button. Keeping Ctrl pressed, point to the symbol, and click, when it turns to a hyperlink. You can also see declaration at the tooltip while keeping Ctrl pressed:
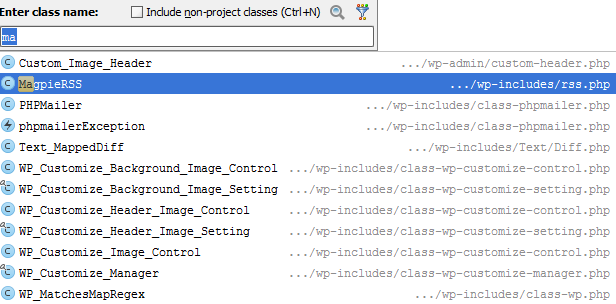
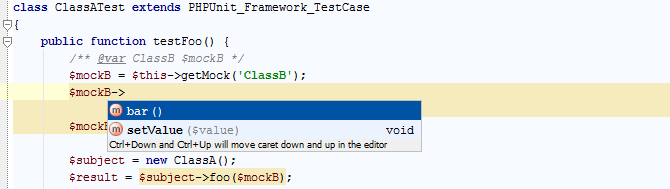
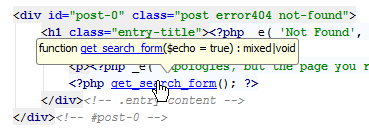
To navigate to the type declaration of a symbol: place the caret at the desired symbol and choose Navigate | Type Declaration or press Ctrl+Shift+B / Cmd+Shift+B. Keeping Ctrl+Shift pressed, point to the symbol, and click when it turns into a hyperlink. You can also see declaration at the tooltip while keeping Ctrl+Shift pressed:
  • Go to line. Navigate to a line by its number. Choose Navigate | Line or press Ctrl+G / Cmd+G:

  • Find usages. If you want to navigate from a symbol to one of its usages within your application, press Alt+F7, or choose Find Usages on its context menu.There are several commands that help you find out where a certain symbol is used: you can jump from one usage to another in the current file (Ctrl+F7 / Cmd+F7), view usages in the current file color-coded (Ctrl+Shift+F7 / Cmd+Shift+F7), or across a whole project in a popup list (Ctrl+Alt+F7 / Cmd+Alt+F7):
  • Search. Search in source code with Ctrl+F / Cmd+F: start typing your search string, and immediately navigate to its occurrences in the current file. The IDE goes even further: it helps you look for a certain string within a directory, or any arbitrary scope, or an entire project (Ctrl+Shift+F / Cmd+Shift+F):

  • Quick search. Quick search is the easiest way to find a file: make sure the Project tool window has focus, start typing and you’ll see the matching nodes highlighted in the tree view. In fact, this method of finding files or symbols works in any tool window:

Learn these essential navigation and search practices and you’ll find your way around your code in no time!

Develop with pleasure!
– JetBrains Web IDE Team

Navigate your code with bookmarks

$
0
0

While coding you continuously move from one part of your code to another, switching between classes, functions, files, etc. You have to keep in mind so many places in the code that you are currently working on. No wonder then that it’s really easy to get lost in thousands of lines trying to find the one you need to edit right now.

To make navigation around your code faster and more accurate, and help you not get lost or confused, there are bookmarks. With bookmarks you can mark the lines you need to remember and easily jump from one to another.

This functionality is available in IntelliJ IdeaPyCharmWebStormPhpStorm, RubyMineAppCode.
There are two types of bookmarks you can use:

  • Anonymous bookmarks (an unlimited number of bookmarks are allowed within a project):
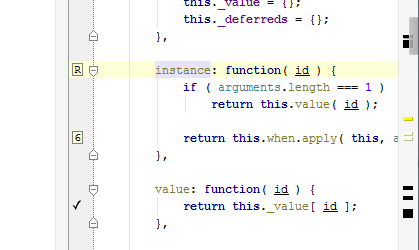
    Anonymous bookmarks are indicated with a tick on the left gutter. To add bookmark on the current line, press F11 (or select Edit | Toggle Bookmark). If you need to delete a bookmark, press the hotkey again.
  • Bookmarks with mnemonics (up to 10 numbered and up to 26 lettered bookmarks are allowed within a project):
    Bookmarks with mnemonics are indicated by number or literal assigned to it on the left gutter. In order to add a bookmark with mnemonics on the current line, press Ctrl+F11 (or select Edit | Toggle Bookmark With Mnemonic) and press/choose a key (0-9 or A-Z). In order to navigate faster between numbered bookmarks within a project, press Ctrl+Number where the Number corresponds to the desired bookmark:

All bookmarks are indicated with black streaks in the marker bar on the right.
In order to view all bookmarks in your project, invoke the Bookmarks tool window by pressing Shift+F11 hotkey (Edit | Show Bookmarks):

You can also:

  • navigate between bookmarks,
  • delete bookmarks you don’t need anymore,
  • or add a short bookmark description to remember what can you find when you choose that bookmark:

Give bookmarks a try and you’ll never again get lost in your own code or waste time switching between parts of your code!

Develop with pleasure!
– JetBrains Web IDE Team

PhpStorm Type Inference and Mocking Frameworks

$
0
0

Recently, we received a question on Twitter asking about how PhpStorm handles type inference when working with mocking frameworks. Imagine having the following two classes:

When writing a unit test for ClassA, it’s very easy to mock ClassB using PHPUnit’s mocking capabilities. By mocking ClassB, you can mold an instance of ClassB and add additional validations on it without having to modify the code for ClassB. For example, you might want to validate that there’s only one call being made to ClassB’s bar() method.

PhpStorm gives you code completion on PHPUnit so it’s really easy to setup a mock object for ClassB:

By default, PhpStorm is capable of figuring out the available methods on the mock object. However, it only displays those for PHPUnit’s PHPUnit_Framework_MockObject_MockObject class. Fortunately, we can solve this by instructing PhpStorm to infer type information from other classes as well, by using a simple docblock comment. Adding such comment can be done using PhpStorm’s “Add PHPDoc comment” intention (ALT+Enter on the variable):

If we only want to have type information for ClassB, we should use:

To have type information for multiple classes, ClassB and PHPUnit’s mock object, we can use:

A little trick that makes your development a lot easier. Enjoy!

Develop with pleasure!
– JetBrains Web IDE Team


Continuous Integration for PHP using TeamCity

$
0
0

If you have multiple team members, you should be doing Continuous Integration (CI). By building the desired output artifacts on a frequent basis and analyzing their quality using unit tests and code coverage, you will find that there are fewer integration problems in working on a software project.

In this blog post, we’ll be using the open-source PHP project PHPExcel as a sample project to set up Continuous Integration using TeamCity. This project features a large amount of code, PHPUnit tests and uses Phing to create build artifacts. We’ll use TeamCity to get this process completely automated and ready for immediate feedback once the source code on GitHub changes.

Installing the TeamCity environment

TeamCity can be downloaded and installed on various platforms such as Windows, Mac OSX and Linux. The installer contains two applications: the TeamCity web interface which we will be using to set up our continuous integration process and a build agent, a small service that listens for build commands and can run the CI configuration. Every TeamCity setup can have one or more build agents on one or more machines.

Since installing TeamCity on various platforms is a bit different, we’ll not go into detail on the installation. We have an installation guide available that can be used to get TeamCity up and running.

Before setting up our CI process, we’ll assume that you already have a PHP environment with PEAR, PHPUnit and Phing installed. If not, now is the time. You can find more info on installing TeamCity on Linux and on configuring your PHP environment through this blog post.

Setting up the project

After installing TeamCity, log in via the web interface. The first thing you will see after logging in is the projects overview. This screen will show you the various projects you have configured in TeamCity and gives immediate feedback on the status of these projects.

Since we’re on a clean install, let’s create a project. Under Administration | Projects, click the Create project button. The first thing we’ll have to do is give the project a name and a description.

The next thing to do is creating a build configuration. This can be anything meaningful to your team: a build configuration per branch (although it’s better to use TeamCity’s feature branching), a build configuration for code and a separate one for documentation, or a build configuration per release.

We’ll create a build configuration named “Main”. Every build will be named with a number. This can be anything you want but since PHPExcel is currently in the 1.7.6.x range, let’s go with “1.7.6.{0}”. TeamCity will automatically increment the revision version for every build. The build counter starts at 1, so our first build will be versioned 1.7.6.1.

PHPExcel’s build script creates build artifacts under the ”build/release/*” folder. TeamCity can grab these from the configured artifact paths and display them in the TeamCity web interface once the build is finished. Don’t worry: we can configure artifact paths later.

In the next step, we have to provide Version Control System (VCS) settings. TeamCity supports a variety of version control systems such as Git, Mercurial, CVS, Subversion and many more. We’ll go with Git and configure TeamCity to fetch sources from https://github.com/maartenba/PHPExcel.git. Note that if required we could add a number of options to the VCS settings: which branch to clone, whether to include submodules, at what interval TeamCity should check for changes, and so on.

After adding the version control we can start adding build steps. We’ll start with…

Unit tests

As a first step in the build process we’re creating, we want to make sure all tests are green. Whenever there is a failing unit test, we want to fail the entire build and not provide any build artifacts. TeamCity comes with a number of predefined build steps for Java and .NET, but since we’re on PHP we’ll have to select the Command Line build runner.

Since we want to run unit tests, the custom script could read something like phpunit -c phpunit.xml to run the PHPUnit configuration that’s in PHPExcel’s source code. Since there are a lot of unit tests to be run, why not report test results to TeamCity real-time so that our team members can see what’s happening? I’ve created a wrapper around PHPUnit which uses service messages to report build results. You can download this wrapper here and locate it somewhere on the build agent or have the build agent download it from the above GitHub repository directly using a second VCS root. If you want to use standard PHPUnit, add an XML report processing build feature which processes PHPUnit’s JUnit compatible XML report. This can be done after storing the current build step.

We can now run our build: click the Run… button to start a build, go to the project dashboard and watch in real time which unit tests are passing or failing.

Congratulations on your first build for a PHP project using TeamCity! Now let’s add some more build steps since just running unit tests is only the first step…

Build using Phing

Our next build step will be invoking Phing, a PHP project build system or build tool based on ​Apache Ant. PHPExcel comes with a Phing build script which we’ll invoke after all unit tests have passed. Find the Build Steps again by clicking the Edit Configuration Settings link at the top-right in this screen.

Next, add a new Command Line build step. This time we’ll invoke Phing’s command-line tool and pass some parameters to it:

phing -f buildbuild.xml -DpackageVersion=%system.build.number%
    -DreleaseDate=CIbuild -DdocumentFormat=doc release-standard

PHPExcel has four build targets defined (release-standardrelease-documentation, release-pear and release-phar), all providing different build artifacts. The release-standard target which we’ve now specified at the command line is the default build for PHPExcel which generates a ZIP file containing all source code and phpDocumentor output.

We are also passing Phing the current build number from TeamCity using Phing’s -D command line switches. The build script can use these to create the correct file names. TeamCity actually provides a lot of variables you can use, including source control details like revision number and so on.

If you haven’t configured the artifact paths while creating our build project, it’s best to do so now (see “Setting up the project”). We want to make sure that the ZIP file generated in this build script is available from TeamCity’s web interface.

Try running another build. You’ll now see that unit tests are being run and afterwards the Phing build script is being run. From the project dashboard, navigate to the build that’s running and open the Artifacts tab. Once the entire build is completed, you will find the ZIP file generated by the Phing build script is now available for download. The best thing is that you can even configure guest access to TeamCity so the users of your project can come and download continuous integration artifacts.

Nice, isn’t it? Let’s see what else is possible. How about…

Code Coverage

The first build step we created was running unit tests using PHPUnit. The nice thing about PHPUnit is that it can provide code coverage information as well, nicely formatted as an HTML report. What’s even nicer is that TeamCity can display HTML reports on a custom tab in the build results.

Let’s first make sure code coverage is enabled. Edit the first build step (running PHPUnit) and make sure it uses PHPExcel’s phpunit-cc.xml configuration file for configuring PHPUnit. This configuration file which is specific to PHPExcel outputs its code coverage report in the unitTests/codeCoverage folder. While it is possible to add all generated files to TeamCity as a build artifact, it’s cleaner to ZIP that entire folder and make it available as one single file. We can have TeamCity create this ZIP file for us by using a special artifact path pattern! Edit the build artifacts again and make sure the following two artifact paths are specified:

build/release/*%system.build.number%*
unitTests/codeCoverage =&gt; coverage.zip

That’s right: we can make TeamCity create a ZIP archive from the unitTests/codeCoverage path by simply using => and specifying a target artifact name.

Next, navigate to Administration and edit the PHPExcel – CI project. Under Report Tabs, we can add a custom report tab and point it to a file in the ZIP file we’re creating every build.

Run the build again. Once it completes, the Artifacts tab should contain the coverage.zip file we’ve just created. Next to that, there should now be an additional tab Code Coverage available which displays code coverage results:

Using the same approach (zipping HTML files and adding a custom report tab), it’s very easy to add additional build reporting and display results from PHP mess detector, PHPLint or even have a tab available which displays phpDocumentor contents.

What else is there?

TeamCity is a very versatile product. In this post, we’ve seen that while there is no PHP support out-of-the-box, it is very easy to configure Continuous Integration for PHP with it. Next to this flexibility, a number of additional reports are available. For example, build history is tracked and you can check what happened in previous builds:

Another interesting tab is Statistics. This tab shows general build statistics such as success rate, build duration and test count in a graphical format.

Another thing I like when reviewing build results is the possibility to dive into the changes that are included in a specific build. For example, we can get a global overview of all changes:

Note that we can drill down in the changes and inspect in which build a specific change was included for the first time or diff with a previous version:

When working with an environment based on the IntelliJ Platform, like PhpStorm or WebStorm, it’s easy to link TeamCity with the IDE. After installing the TeamCity plugin into your IDE you’ll notice that there are some useful little things like opening a unit test in the IDE from within TeamCity:

Feel free to experiment with TeamCity: it’s 100% free for up to 20 build configurations!

Develop with pleasure!
– JetBrains Web IDE Team

Rapid File Creation with File Templates

$
0
0

Many different files are created in the course of development, and the bigger your project grows, the more files it involves. However, most files are typical and can contain pre-defined information you don’t need to type every time you create a new file. It can be framework-specific constructions, template, copyright information, classes, includes or anything else.

To make this workflow smoother, you can use File Templates to define templates for newly created files you usually work with. Learn how the IDE can simplify the file creation process for you.

This functionality is available in IntelliJ Idea, PyCharm, WebStorm, PhpStorm, RubyMine, AppCode.

You can create a new File Template in Settings | File Templates, or just save the current file as a template by selecting Tools | Save File as Template.

PhpStorm and other IDEs based on the IntelliJ Platform come with a set of predefined file templates. You can use these templates as-is or modify them as necessary. You can also create your own file templates.

Let’s create our first file template either from existing file or from scratch. In our case it’ll be PHP code setting some Smarty template engine parameters and displaying the template.

First of all, we need to specify the Name and Extension. Then we can add the whole block of code we are going to save as a template.

File templates are written in Velocity Template Language (VTL). They may include:

  • Fixed text (markup, code, comments, etc.),
  • File template variables. When the file is created the variables are replaced with their values,
  • #parse directives to include other templates, and/or
  • Other VTL constructs.

#parse directive includes other templates specified in Includes tab. It is usually very convenient to define copyright or text/comment header information to be used across different templates. The Code tab keeps internal files templates and cannot be deleted.

You can use predefined variables such as ${PROJECT_NAME}, ${PRODUCT_NAME}, ${USER}, ${NAME}, ${DATE}, ${TIME} and others. When a file is created from a template, these variables will be automatically replaced with current values.

Custom variables can be used as well and in case they are not defined, user will be asked to type it before file creation. You can also use Velocity constructs such as if, foreach, etc.

For our example template, we create two custom variables: ${Title} and ${TemplateName}. The PHP variable $smarty is escaped with slash (“”) so that the user doesn’t have to type it before file creation. More about escaping characters in Velocity variables and directives.

Now we are ready to create a file from this template. Just create a new file the way you do usually, then choose the SmartyPage template in the list.

You will be asked to enter the new File name (required for every template) and our custom variables (Title and TemplateName in our case).

After you click OK, the file is generated from the template with the appropriate variable values.

Set up as many file templates as you need and create specific files you need in just a few clicks!

Develop with pleasure!
– JetBrains Web IDE Team

Using GitHub without leaving PhpStorm

$
0
0

In a previous post we saw how PhpStorm handles Version Control Systems (VCS). A very popular VCS is Git, driven by the collaboration that’s possible using GitHub. In this post, we’ll explore several integrations with GitHub that are available from within your IDE:

  • Create a GitHub repository
  • Clone a GitHub repo
  • Create a gist on GitHub
  • Open in browser
  • Use the GitHub issue tracker

Next to those actions, PhpStorm provides full support for the Git VCS like commit and update file/directory or an entire project, changelists, revision support and so forth. More on these features can be found in our earlier VCS overview post.

This functionality is available in IntelliJ Idea, PyCharm, WebStorm, PhpStorm, RubyMine, and AppCode.Before we start, make sure that PhpStorm knows the path to your Git executable. Refer PhpStorm web help on how to do this (“prerequisites”).

It’s also best to make sure that you have registered your GitHub account credentials or signed up for a GitHub account through PhpStorm. Doing this ensures that you don’t have to provide your GitHub account details every once in a while.

Create a GitHub repository

Whenever you want to start a new project on GitHub, there’s always a bit of a chicken-egg problem. Do you start coding and then push the initial code to GitHub? Or do you create a project on GitHub, clone it locally and then start coding? Depending on what you like for breakfast (chicken or egg), PhpStorm supports both, right from the IDE.

Once our project is ready to be published on GitHub, we can use the VCS | Import into Version Control | Share project on GitHub menu item to start publishing the project.

PhpStorm will then ask us to provide a repository name and description. After doing that, click the Share button.

There we go: our project is now available on GitHub and we haven’t left our IDE! From now on we can use any other command from the VCS menu as described in this post.

Clone a GitHub repo

What if we want to continue working on an existing project hosted on GitHub? Typically, we would have to open a browser and navigate to the repository website to copy the URL we can clone using Git. Another approach would be memorizing the repository URL and cloning that. Why not clone a project from GitHub right from within PhpStorm?

From the VCS menu, we can use the Checkout from Version Control | GitHub command. This will fetch a list of all repositories that we can access using our account and allows us to clone those into a PhpStorm project:

After clicking the Clone button, we’ll have the entire repository contents available locally and can code away. Once finished, simply use the traditional Git commands from the VCS menu.

Create a Gist on GitHub

If you’re unfamiliar with gists: they are a simple way to share snippets and pastes with others. They can be created, browsed and commented through https://gist.github.com/. Why copy/paste code from our IDE into a browser window if all it takes is a right-click?

From any file that’s opened in the IDE, we can make a selection of code, right-click and use the Create Gist… context menu. We can provide a description and optionally make the gist private or anonymous.

After you click OK, the selected code (or the entire file if no code was selected) will be uploaded as a gist to GitHub.

Open in browser

Ever wanted to see all details on the file you’re working on? Right-click a file and select Open in browser from the context menu. This will launch the default browser and open the file we’ve clicked on in GitHub. This allows us to see file history, explore branches and whatever other action we may want to do through the GitHub web interface.

Use the GitHub issue tracker

Working on a project often means working with issue tracking. And since GitHub has an issue tracker, let’s explore how that integrates with PhpStorm. To do so, there’s a small configuration step we have to take first.

From the File | Settings menu, we’ll have to open the Tasks | Servers pane under the current project settings and do some minor configuration: add the issue tracking server we want to use. Add a new server, enter the URL to your GitHub repository and provide the required credentials. Under the Commit Message pane, enable the Add commit message option and optionally customize the commit message that will be generated when we complete a task.

From now on, we can work with issues from GitHub and correlate source code commits with specific issues and tasks. Let’s create a new task. On the main menu, choose Tools | Tasks & Contexts | Go to Task or simply press Alt+Shift+N. This will open up a dialog which allows you to select an existing task to work on or create a new task.

We can now enter the task we want to work on and press Ctrl+Enter (Mac: Cmd-Enter) if the suggested task is the one we meant to be working on. After clicking OK this dialog will close and PhpStorm will close all files currently opened and create a new context for the work we’re going to do. On a side note, if we wanted to have more details on the task we’ve just selected we can use the Tools | Tasks & Contexts | Open task in browser menu or press Alt+Shift+B. This opens up a browser window with the issue logged on GitHub if you require additional information.

After making some changes, we first have to make sure PhpStorm captures all changes made to our project in a changelist. Use the Tools | Tasks & Contexts | Create Changelist… menu to do so. A changelist is a set of changes in files that represents a logical change in source code. The changes specified in a changelist are not stored in the repository until committed (pushed).

We can now work on other tasks and create changelists for them. Once we feel our code is good to be stored in the VCS again, we can use the VCS | Commit Changes… menu or Ctrl+K (Mac: Cmd-K) to commit changes to the repository. Note that the commit message is automatically generated based on the issue we were working on:

When working with PhpStorm, a lot of GitHub functionality is integrated in the IDE. We’ve done a couple of tasks that are normally performed either on the command-line or through the browser, right from the IDE. This integration will help you be more productive because there’s less context-switching occurring.

Develop with pleasure!
– JetBrains Web IDE Team

Quickstart with Docker in PhpStorm

$
0
0

So, you’ve decided to try something new today and started a project from scratch. Your first step will be to set up a development environment: at the bare minimum, you’d want to run a web server and a PHP interpreter (preferably – with the debugging engine installed).

With Docker, you can start developing, running, and debugging your code in a matter of minutes!

Probably the easiest way to integrate Docker with PhpStorm is to use the PhpStorm Docker registry. It provides a selection of preconfigured Docker images curated by the PhpStorm team, which cover the most common PHP development needs.

Before you proceed, make sure that you have Docker installed on your machine: see how to do it on Windows and on macOS.

Defining the environment

To get started, we create a new project in PhpStorm. Next, we create a new file named

docker-compose.yml
 , which will describe the configuration of the services comprising our app. In our case, it will be a single webserver service:
version: '2'
services:
  webserver:
    image: phpstorm/php-71-apache-xdebug-26
    ports:
      - "80:80"
    volumes:
      - ./:/var/www/html
    environment:
      XDEBUG_CONFIG: remote_host=host.docker.internal

As you can see, we use the preconfigured Docker image comprising the Apache web server and PHP 7.1 with Xdebug.

Note that we use the

host.docker.internal
  value to refer to the remote host. In Docker for Windows and Docker for Mac, this value automatically resolves to the internal address of the host, letting you easily connect to it from the container.

Our environment is fully described:

docker-compose

To start using it, we need to create a dedicated run/debug configuration.

Creating a run/debug configuration

Right-click

docker-compose.yml
  and select Create… from the context menu:

create_docker_compose_run_config

In the dialog that opens, provide the name of the configuration and apply your changes:

create_docker_compose_run_config_dialog

You can now start the configuration from the toolbar:

run_config_run_toolbar

PhpStorm will automatically download the required image and start the web server:

docker_start_service

That’s it: we’ve got everything ready for running and debugging our code!

Running and debugging code

Let’s ensure that everything works as expected. To do this, we’ll create the most simple Hello world PHP file and try to debug it following the PhpStorm Zero-Configuration Debugging approach.

Since we already have Xdebug installed and configured, this will only require that you:

  • Have a debugging extension installed and enabled for your browser:chrome_debug_extension
  • Set a breakpoint in your code:
    breakpoint_set
  • Enable listening to incoming debug connections in PhpStorm:enable_listening_debug_connections

Now, simply open the page in the browser, and the debugging session will be started automatically:

debugging_started

We encourage you to further explore the PhpStorm Docker registry: while we’ve looked at a very simple case, you can use the described technique to provide your environment with, for example, a database, or an sftp server.
Using these Docker images will save you a lot of effort and let you start coding in a matter of a minute, or even less!

If you’d like to learn more about Docker and how to use it in PhpStorm, make sure to check out the excellent tutorial series by Pascal Landau, and PhpStorm documentation, of course.

Your JetBrains PhpStorm Team
The Drive to Develop

HTTP Client in PhpStorm Overview

$
0
0

When developing a web service, you would usually test it by sending all kinds of HTTP requests to it and examining what’s returned. In PhpStorm, you can do this directly in the code editor.

In this post, we’ll use the github.com/JetBrains/phpstorm-http-client-tutorial example project to demonstrate. You can clone it and navigate through its commit history to get to the corresponding phase of this overview. For each phase, run composer update to install and update what’s required, and then composer start to start the PHP web server.

Looking around

In PhpStorm, your HTTP requests are stored in regular files with a .http or .rest extension. Having created one, type the URL inside. For simple requests such as GET, this is enough, so you can press Alt+Enter and select Run to execute the request right away. The request is executed, and the response is displayed in the Run tool window.

create_run_request

An .http file can hold as many requests as you need. You can separate them by typing ###. If you execute a request, PhpStorm will even add this separator automatically, saving you from the hassle of having to type it each time. Not only this but you can also cut down on typing and speed things up a little by using live templates. To view all the available templates, press Cmd+J (Ctrl+J on Windows). As an example, let’s use “gtr”, which expands into a GET request skeleton:

create_run_gtr_request

As soon as you run the request, PhpStorm automatically creates a temporary run configuration for it. Now, if you change something in your PHP code, you can press Ctrl+R (Shift+F10 on Windows) to rerun this configuration and test the changes right away, without switching context.

http_request_run_config

Sometimes you may want to perform some ad-hoc testing: run a particular method and compare what’s returned between requests. For this purpose, you can use Scratches. They behave like regular physical files, but are not meant to be stored inside the project.

To get started, create a new .http scratch file, and compose your request inside. When you run it, the information on the received response will be added in the very same file, directly under the request. Run it again to get the link to the next response, and so on. Now, you can click the button in the editor gutter, and compare the received responses on the spot via the differences viewer.

compare_scratches

Scratch files are intended to be ditched as soon as they are not needed, but what if you like a particular request? Then you can keep it with the project: select Refactor | Move file and move it to a regular .http file. As with any other project files, you can now commit it to a VCS, share it with your team, and use it as a reference for testing or documenting your Web API.

As a recap, click the Open Log link in the editor’s top right-hand corner. Here, you can view the last 50 executed requests, rerun any of them, or open the response file in the editor.

requests_history_upd

Authorization and Variables

If your web service requires authorization, you can access it by providing the Authorization header, the authentication method, and the required credentials in your HTTP requests. This way, however, your credentials become part of the request, and sharing them is probably not a good idea.

request_with_credentials

Here, environment variables come to the rescue: we can replace the desired values with variables and then put them in place as soon as the request runs. Inside the requests, variables are provided enclosed in double curly braces, like this: {{MyVariable}}.

To have the possibility to target different servers, let’s start by replacing the host with {{HOST}}; then, we’ll replace the user and password values with {{USER}} and {{PASSWORD}}. This way, we’ve turned these values into variables.

request_with_variables

To define these variables, you need to create a new file and name it http-client.env.json. Inside the file, define the environment standing for a specific server, and a set of variables for it.

env_json

Since the http-client.env.json file will be shared with the project, too, we can take it a step further, and isolate username and password. So let’s create another file and name it http-client.private.env.json. Private is key here – this file is intended to hold sensitive data, and it even gets ignored by a VCS by default. Inside the file, we will replicate our environment, and then provide the username and password.

private_env_json

When we run the request, PhpStorm substitutes the variables with actual values. What’s more, your teammates can reuse the same request, but tailor it to their environments.

Scripting

In the HTTP client, you can see what the web service returned and can react to it programmatically.

Let’s consider this example: when we run the first request, our web service returns a JSON response. We can then compose a simple script that will modify it, so that we can send the modified data back to the server using the second POST request.

get_post_requests

Response handler scripts are enclosed in > {% %}, written in JavaScript, and executed as soon as a response is received.

In our first script, we refer to the response object, which contains information about the received response, and then grab the response body JSON and modify its New features key’s value. Next, we refer to the client object, which stores the session metadata until you restart PhpStorm, and save the modified response body to a new myResponse global environment variable.

> {%
  response.body["Stable release"] = "2019.3";
  client.global.set("myResponse", JSON.stringify(response.body));
%}

When we rerun the request, the response gets modified and saved. In the second POST request, which sends the JSON data to the server, we can now set the myResponse variable as the request body, and run it to store the data on the server.

get_post_requests_variable

You can now rerun the first GET request – and make sure it returns modified data.

Testing

While it worked out pretty well this time, imagine having more scripts with all kinds of response values, conditions, or logic attached – checking each of them manually will eventually become a burden. Let’s make PhpStorm do it for us.

We will enhance the script so that it includes the actual test. Here, we use the test method, inside which we provide the name of the test, and then – the function that runs the test. Inside the function, we use the assert method, which checks the value of the response body JSON key, and outputs an error message if the condition is not met. You are not limited to a single check, of course – notice that we also added a condition checking the response status.

> {%
  client.test("Version", function() {
  client.assert(response.body["Stable release"] === "2019.3", "Returned no info on the latest
release");
});

  client.test("Status", function() {
    client.assert(response.status === 200, "Response status is not 200");
  });
%}

Now, when you run the request, PhpStorm will provide you with the tests’ results on the dedicated Tests tab. Should anything go awry, the test will fail, but you will know exactly what went wrong and can fix it right away.

tests_tab

We hope that this post sheds some light on what’s possible with the HTTP Client. See the HTTP Client docs to learn more, and make sure to check out the PhpStorm blog from time to time to keep up with the latest features.


Latest Images